Table of Contents
Monitoring
System log (syslog) and ze-filter log files
The main rule of ze-filter logging is : Each unusual thing ze-filter find or does, is recorded somewhere for further analysis.
Main logging is done using syslog resources. Every connection is logged using this ressource and all action taken by the filter, other than transparent handling, generates a log line with a summary of the action. This is the first source of information to check when you're trying to understand what happened to some message as it includes not only the summary of what happened, but also two useful information if you need to investigate deeper : a unique message/connection ID (needed to check other ze-filter log files) and the sendmail msgid (useful if you want to correlate the filter handling with a sendmail message ID).
Other than system log, ze-filter maintains some log files inside /var/ze-filter directory. Currently the following text files are used : ze-files, ze-virus, ze-xreport, ze-regex and ze-stats. This is the default location, but ze-filter may use a remote UDP server to log the corresponding data.
Command line tools
ze-printstats
ze-filter periodically (once each 2 minutes) dumps its internal counters into some disk files. ze-printstats is a command line tool which allows you to get many information about ze-filter state based on these data. Eventually, the information may be old, but no more than 2 minutes old, and this may be enough.
Some examples of thing you can get with ze-printstats :
# summary of ze-filter activity since last time it was launched
ze-printstats -a
# summary of ze-filter activity in the last 18 hours
ze-printstats -q -l 18h
# summary of activity of SMTP client 12.13.14.15 against this
# mail server in the last 24 hours
ze-printstats -q -l 1d 12.13.14.15
# which SMTP clients had connections rejected by connection rate
ze-printstats -q -l 1d -m rt
# which SMTP clients are doing too many recipient errors
ze-printstats -q -l 1d -m rb
# which SMTP clients had been rejected by greylisting
ze-printstats -q -l 1d -m rg
# ze-printstats -h
ze-ndc
While ze-printstats gets its work information from data recently saved by ze-filter, ze-ndc uses connects to the filter over some INET port/socket (like telnet), and can be use both to get real time information and to send commands to the filter. You can use ze-ndc to connect to instances of the filter running on different computers.
Roughly speaking, you shall use ze-ndc to get real-time information, or information in the really short past. If you want to get the summary on the filter activity on mean or longer past, ze-printstats is the tool to use.
As an example, you can use ze-ndc to list which remote SMTP clients have open connections being handled by the filter.
# ze-ndc stats CONNOPEN
# [Connected to 127.0.0.1:2010]
200 OK - Waiting for commands !
200 OK for STATS CONNOPEN !
*** Open connections :
  138.102.122.218   :   1 : paris.inra.fr
  139.124.6.1       :   1 : iml.univ-mrs.fr
  206.190.49.39     :   1 : web53009.mail.re2.yahoo.com
  212.51.172.100    :   1 : srvmailgw.cci63.net
  216.239.58.190    :   1 : gv-out-0910.google.com
  62.193.216.46     :   1 : raq61.amenworld.com
  82.167.14.70      :   1 : unknown
  87.248.110.17     :   1 : omp101.mail.ukl.yahoo.com
    8 entries on database
200 STATS CONNOPEN done !
An example of things you can do :
# getting the filter version
ze-ndc version
# listing open SMTP connections
ze-ndc stats connopen
# getting server rates
ze-ndc stats throttle
# reload configuration files
ze-ndc reconfig
# reopening constant databases (after updating them)
ze-ndc reload databases
# getting the list of possible options
ze-ndc help
ze-ndc help stats
Monitoring with munin
If you monitor your mail server with munin, there are two plugins inside directory contrib/munin :
ze-filter_counters_- a plugin to monitor ze-filter;sendmail_mailq- this is better (IMHO) than the default plugin intended to monitorsendmailqueues.
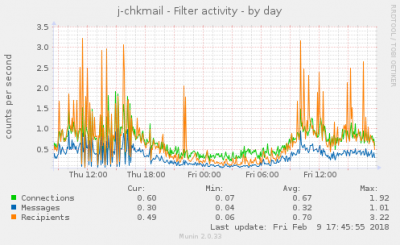
 It will show the following graphics :
- Filter activity;
- Behaviour filtering;
- Content filtering;
- Greylisting activity;
- Statistical classifier;
- Ratio Spam/Ham as seen by the filter;
- XFiles detected;
- Static databases : number of records;
- Greylisting databases : records per kind of entry;
- Volume handled by the filter;
To install and configure the ze-filter_counters_ plugin, just copy it to the default munin plugins directory, and use the standard munin tool to enable it :
- and configure
# cp ze-filter_counters_ /usr/share/munin/plugins/
#/usr/sbin/munin-node-configure --shell --families=auto,contrib 2>/dev/null | \
        grep ze-filter | /bin/bash -x
Creating web pages
You can use the scripts found at contrib/rrd-ze-filter directory to greate graphical web pages representing the activity of the filter in real time. See an example at : http://foss.jose-marcio.org/webgraph/
Take a look at the contrib/rrd-ze-filter/README file.
To put this in place, it's very simple :
- The server running the filter shall have any kind of web server (
apache, …); - Copy the content of this directory
contrib/rrd-ze-filtersomewhere in the web-server tree; - initialize the
rrddatabase - add a task to your
crontab - webpages will be visible at :
- and initialize
$ cd /path-to-source/contrib
$ cp -pr rrd-ze-filter /somewhere/
$ cd /somewhere/rrd-ze-filter
$ make init
0-59/5 * * * * cd /somewhere/rrd-ze-filter; make update
You can also use command line tools, launched by cron, to create text web pages.